Store Analytics data for ecommerce is still rarely consulted and under use in Prestashop-thirtybees. But in the last couple of years it has gained traction, and is now one of the top trends for ecommerce platforms. It is by understanding these data that you can better serve your customers and grow your online business. There is a massive potential for ecommerce growth analytics provide that we can exploit.
As data experts Gordon Linoff and Michael Berry explain in their book, Data Mining Techniques,
“forward-looking companies are moving toward the goal of understanding each customer individually and using that understanding to make it easier (and more profitable) for the customer to do business with them rather than with competitors.”
Analytics is one of the 5 Top Ecommerce Trend That Will Only Get Bigger in 2020
Why You should Use Store analytics data more
It is true that many abandon the statistics. Two reasons can be deduce from this: Firstly is because you have to take the time to interpret them. And secondly, the default prestashop-thirtybees store statistics often times does not reflect the real store performance.
Having said that, we cannot discount the truth that with analytics data, especially with large catalog, you can better understand the “hot” zones, and the categories that bring the most order, allowing you to consolidate your offers. This is also important for the purchase of the stock, making it easy to bet on new products in categories which “pay off”, rather than investing with your eyes closed on offers that are too wide-target.
Understanding Analytics data at the client level
With analytic stats you can check whether the age group you are touching is in line with the offer, whether it is in terms of visuals, texts and communication in general. Also take advantage of watching if the creation of accounts is constant, if it evolves from month to month and think of rewarding your best customers, because they are your ambassadors. At the same time, see if newsletter subscriptions are going well… if not, consider making Popup newsletter.
There is a lot of interesting things you can do with analytic stats once you appreciate them. No wonder, Google analytics has become so huge today!
Checking product Catalog health through statistics
Store analytics statistics also comes with features that provide feedback on how your catalog is structured. If we look at the side of the “Evolution of the catalog” section, there is a good indicator to check the general health of your product sheets. Admittedly, the more text you have the better… but you can outright do a quick health check thanks to the green stickers in the dashboard.
Make a monthly check of your statistics
As a final recommendation, set a time limit of 60 minutes maximum everyday to check your stats and then make a small assessment and archive your report. It is important not to spend hours looking at its statistics, you must after 1 hour have established a conclusion for the month, in order to move in the right direction.
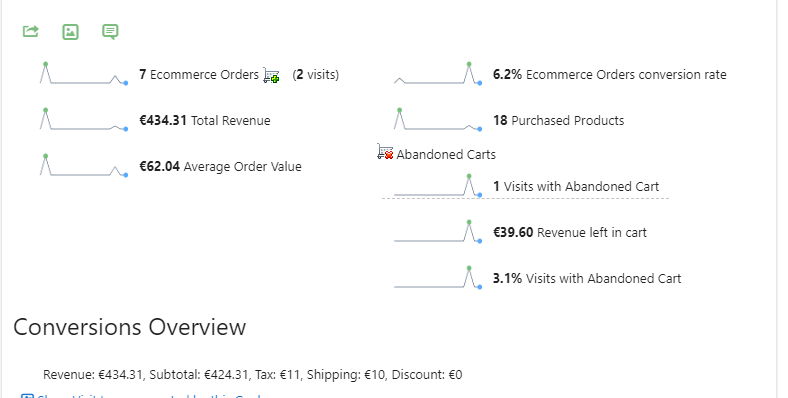
We admit that the default store statistics module has limited capability and cannot offer a comprehensive analysis of your ecommerce store performance. This is the exact reason why Shoptech Media has developed an advance Store Analytics. SM Analytics is a comprehensive and powerful tool every online store must have to fully understand site performance. Check the screenshots below or check the SM analytics knowledge base:
Comprehensive website overview
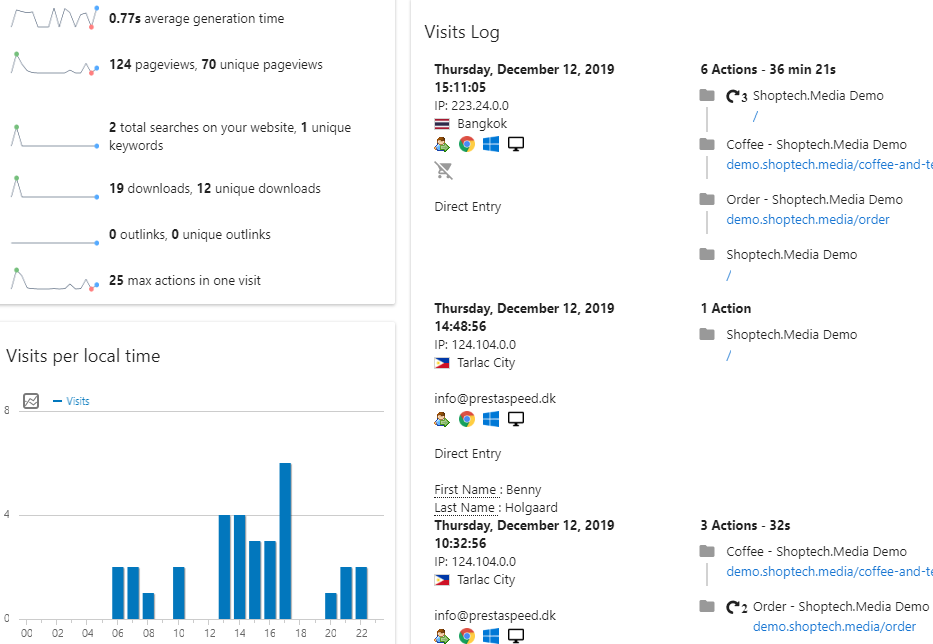
Powerful Visits log..
In conclusion
The picture that store analytics data convey is far from complete. But these insights help businesses to cater directly to their customers with confidence, optimize their resources, and innovate flexibly in-line with changing markets. Summarized into one line: Customer-centric focus!